

You’re the average of the five people spend the most time with.
The above quote closely sums up what K-Nearest Neighbors algorithm is. The only difference is that in KNN the number of friends may vary.
K-Nearest Neighbors is a very simple but intuitive machine learning algorithm and we’ll deep dive into the nitty-gritty details of this algorithm.
What is K-Nearest Neighbors Algorithm?
K-Nearest Neighbors is a classification algorithm(can be used for regression also) that works on the basic principle that the points belonging to the same class should be closer to each other. Let’s understand this with the help of an example

Suppose we have a dataset having two features X1 and X2 and we plot the data points using a scatter plot. In the above image, we can see that the orange dots belong to class 1 and the blue dots belong to class 2.
Now a new datapoints i.e. green dot comes in and we need to classify whether it belongs to the orange class or the blue class.
Now we perform the following steps.
- Select a value of K(here 3) i.e the number of closest points to green dots that we are going to consider.
- Calculate the distance of the green dot with these points to find the K(3 here) closest points.
- After finding the K(3 here) closest points, we check to which class these points belong.
- Now our green dot will belong to that category that has the maximum number of points in selected closest points.
Intuition
The intuition behind K-Nearest Neighbor is that the points belonging to the same category should be closer to each other in comparison to points belonging to different categories.
How do I choose K?
- Choosing the value of k is a highly iterative process.
- You can try multiple values of k and for each value of K, calculate the error rate on the predictions.
- Now plot this K v/s error rate and select the value of k for which the error rate is minimum.
How do we calculate the distance between points?
Now we know how the K-Nearest Neighbors works. Let’s see how we can calculate the distance between the points. There are preferably two methods to measure distance in K-NN.
- Euclidean and Manhattan distance
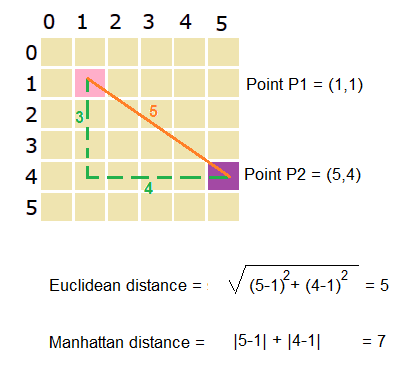
- The above clearly shows both Euclidean distance and Manhattan distance
- Manhattan distance is preferred over euclidean distance when the dimensionality of data is too high.
Impact of data on KNN
- If we have highly imbalanced data, then our KNN model will be biased towards the class having a higher number of data points. This is so because when we’ll be calculating the nearest neighbors, there will be a high probability that most of the points will belong to the class having more data points(this probability will increase as we increase the value of K).
- KNN is highly sensitive to the presence of outliers in the dataset. Outliers adversely affect the performance of our KNN model.
Practical Application of KNN
- Recommender System: KNN is heavily used in recommendation systems like the one you see on websites like Amazon, Netflix, etc. KNN is used to recommend the group which is closest to the category you searched for.
- Concept Search: Concept search is a search based on the concept of searching similar items from an unstructured database based on the query you provided.
Homework for you
- Learn about how we can use scikit learn to implement KNN on our data.
- Learn about how KNN is used in a regression problem.
Till Then Happy Learning!